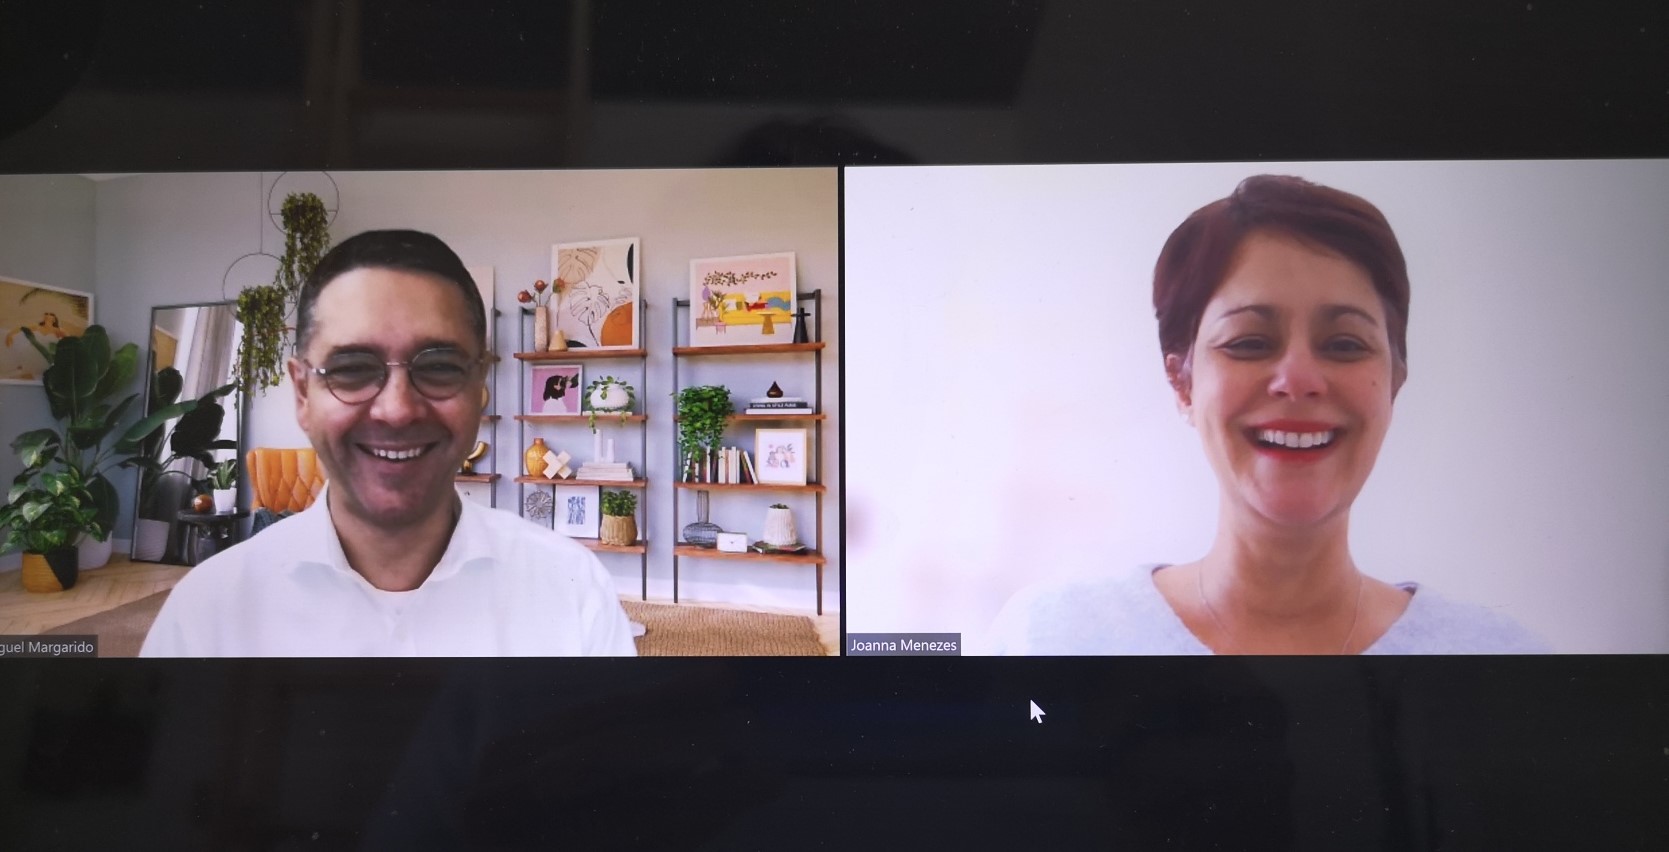
Presenting financial results, accounts or any other data in a business context should not be synonymous with presenting an avalanche of tables or graphs. "Making the numbers talk is about getting something out of them. Numbers alone have no value", explains Miguel Margarido, former finance director in an IT group and currently trainer and professional coach. During his webinar on 18th November 2022, twenty or so members of the Cala Learning Hub network were able to learn more about how to make figures more striking and attractive.
Ask the right questions to become a business partner
According to a study by PricewaterhouseCoopers (Finance as Business Partner, 2017), there are four types of financiers in the business world: from the simple bookkeeper, to the financial commentator and the "health coach" (advisor) to the ultimate stage: the business partner. The latter is more forward-looking and strategic and is valuable because s/he makes a real contribution to the company's business.
To find out which category you fall into, all you have to do is look at how you usually present your figures and then ask yourself the right questions. Are my reports forward-looking or focused on the past? Does it make sense to compare the current month's data with the previous 11 months? Who are the people or departments affected by these figures? And what are their expectations for their businesses ? "It is essential to take the time to analyse the data thoroughly in order to bring out the information that is rellevant and thus help in the decision-making process," summarises Miguel Margarido.
Present data in an effective and attractive way
There is nothing worse than a series of numbers lined up endlessly in tables. For our expert, who usually offers a full 2-day training course on the subject, you need to :
- opt for a Slidedoc format, which is a combination of a Word document and a Powerpoint presentation;
- think about the figures to be highlighted, i.e. those that provide new knowledge and insights
- propose graphs with different designs (treemap, pareto...);
- improve the readability of these graphs (colours, etc.) and present them in a way that makes them more meaningful;
- use the Storytelling technique to give meaning to your numbers and project actions for the future.
Our next meeting will be on 10th January 2023 and this time it'll be a chance to meet face-to-face,in Paris, and have a drink together ! See you then!
Blog article written by par Laure Blancard : https://www.linkedin.com/in/laure-blancard/



 Copyright © 2016 - 2024 - Cala Consulting